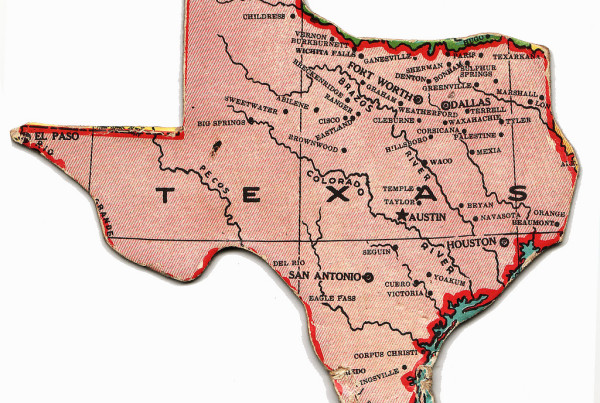
There are some 254 counties in Texas and inevitably if you were to try to map the state’s economic health, you’d probably find some clear winners and losers. But a new survey shows that the answers might no be not be what you’d expect to find.
A new survey by the Austin Business Journal mapped out data from the Texas Relative Economic Community Health Index, or TRECH, to determine the best and worst fiscally sound counties in the state.
Michael Theis, digital editor for the Journal spoke to the Texas Standard about his interactive county-by-county map, which you can view here.
To assemble the map, Theis looked at each county’s population, median household income, and housing affordability index for 2013.
“We were looking at the percentage of people in these counties who are spending more than 30% of their monthly household income on housing,” Theis says. “That’s traditionally the line where we say that’s unaffordable.”
The relatively small Andrews County, with a population of 14,000-15,000 people, has the best score. Theis hypothesizes is due to its locale near an oil field, and the data being pulled close to the oil boom in the area.
Not all the top performers were in west Texas – others were found in the Houston area.
“Chambers County came in number two,” Theis says. “Generally like a lot of counties in the top 25 percent, they were able to show positive movement in housing affordability, positive movement in median income growth, and positive population growth.
Menard County, in western-central Texas, took the lowest score. Why? There are several factors, and Theis says that’s part of the reason he set out to create the map in the first place – to show that when people talk about how well Texas is doing economically, it doesn’t necessarily mean everyone is benefiting.
“A lot of the job growth in Texas is going to urban areas,” he says. “A lot of that activity isn’t really spreading out evenly across the state.”


